Compare with recent Mouse Genome sequence paper.
(Figures for Nature paper are direct links to Nature Website)
Draft genome sequence of physical map
Map covers 96% of genome, actual sequence spans 94%, including gaps
Eight times larger than all genomes sequenced before it
Used hierarchical shotgun sequencing
Genomic DNA was partially digested to form bacterial artificial chromosome libraries.
Random clones were mapped onto genome.
Specific BACs were chosen for sequencing based upon optimal overlapping of BACs on genome
Individual BACs were then sheared for shotgun sequencing and sampling.
This approach helps minimize some complications in sequence assembly of entire genome, due to repeats and large genome
Also avoids problems caused by heterozygous nature of human DNA source
BAC clones (100-200kb each) were generated at 20-fold coverage
Digested with restriction enzymes to generate a fingerprint for each BAC
Clones were aligned with each other based upon the fingerprint sequence
BAC clones were then sheared for subcloning and shotgun sequencing
Sequence was assembled for each BAC clone
Clones were then compared with their predicted fingerprints
The sequenced clones were aligned with overlapping sequence clones to construct a fingerprint clone contigs.
These in turn were aligned with the physical map of the chromosome by sequence matches to mapped STS sites

 |
2004 csome |
contigs | N50 size |
| 1 | 37 | 56331646 | |
| 2 | 21 | 68373980 | |
| 3 | 5 | 100530261 | |
| 4 | 15 | 23438009 | |
| 5 | 6 | 41199371 | |
| 6 | 9 | 48945890 | |
| 7 | 12 | 47497097 | |
| 8 | 10 | 38454502 | |
| 9 | 42 | 39435726 | |
| 10 | 19 | 30112613 | |
| 11 | 8 | 38509590 | |
| 12 | 8 | 32815934 | |
| 13 | 5 | 67740325 | |
| 14 | 1 | 88290585 | |
| 15 | 11 | 53619965 | |
| 16 | 5 | 42003582 | |
| 17 | 10 | 21163833 | |
| 18 | 5 | 20074199 | |
| 19 | 4 | 31383029 | |
| 20 | 6 | 26144333 | |
| 21 | 4 | 28617429 | |
| 22 | 10 | 23276302 | |
| X | 21 | 27718692 | |
| Y | 17 | 6265435 | |
| M | 1 | 16571 |
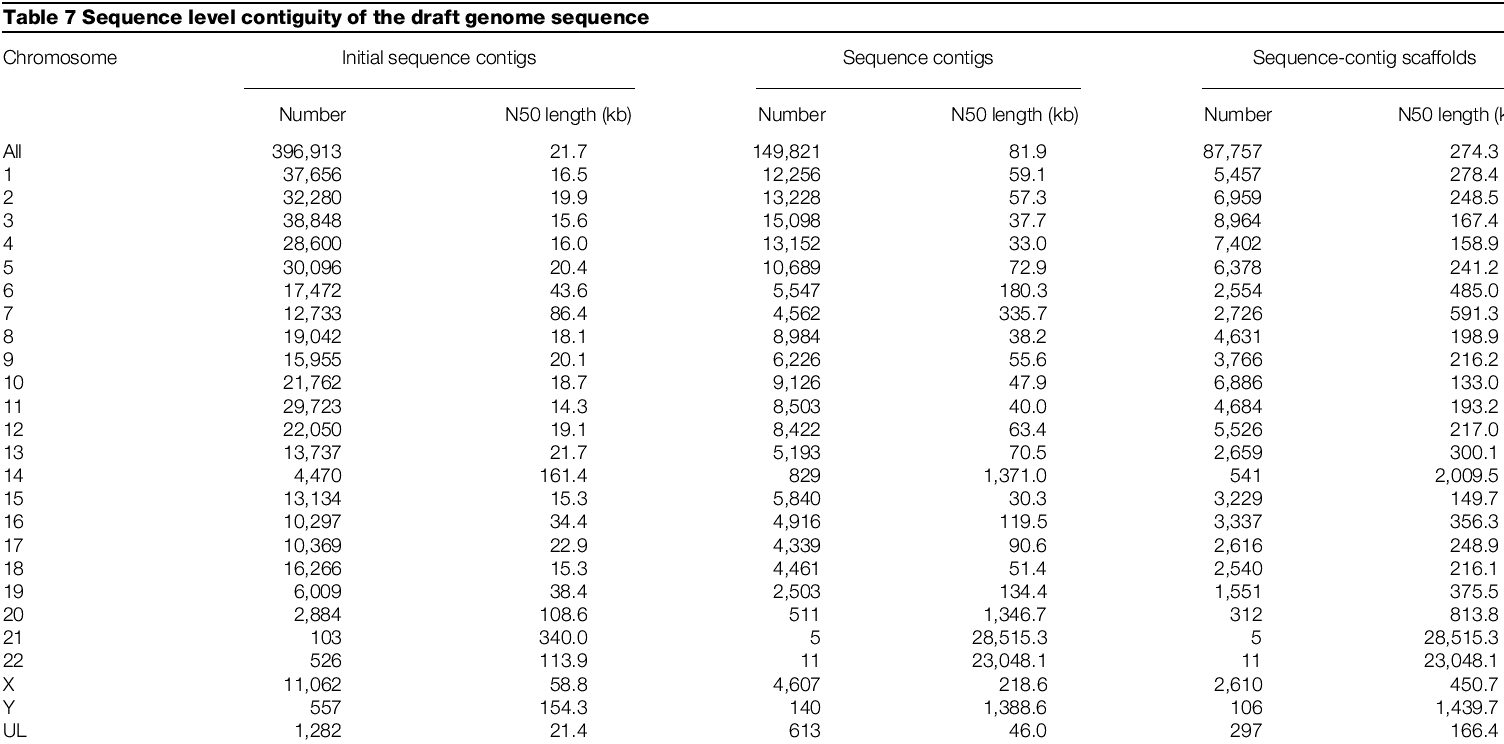
Sequences were merged using Gigassembler program, which aligns sequence from one clone with adjacent ones
Sequence quality then described as N50, the length such that 50% of all nucleotides are contained in contigs of the least this size
Each nucleotide was assigned a quality score by the PHRAP sequence Assembly program.
91% of the draft genome sequence had a less than one in 10000 errors, based upon this score
96% had a less than one in 1000.
Still many gaps in the sequence, however most of smaller than a single BAC clone
Average gap size is believed to be about 25 kilobases
88 percent of known human cDNAs this could be aligned with a genome database
Genome was analyzed for variations in G-C content
Variations were found in G-C content on a number of length scales and may represent mosaic origin of chromosomes
Dark Geimsa bands were found to be regions of low G-C content
It appears that longer chromosome
have a lower recombination frequency, which causes all of chromosomes to have
approximately one crossover per meiosis (figure)
Long interspersed elements (LINES)
Transcribed from Pol II promoter, translated
Assembles core complex of endonuclease and reverse transcriptase on RNA
Then moves to nucleus to integrate into genome
Full size are 6-8 kb. There are 850,000 in the genome, representing 21% of the total genome lengthShort interspersed Elements (SINES- e.g. Alu) shorter than LINE (100-300 bp)
Have Pol III promoter and 3'end similar to LINE so it can use LINE replication machinery
1.5 million copies in genome (13% of total length)Retrovirus-like transposons (450,000 copies, 8% total DNA)
DNA transposons 300,000 copies (3% of genome)

Alu SINE elements appear more frequently in GC rich DNA
Can estimate ages of transposed elements based upon phylogenetic analysis.
Older Alus appear to have accumulated in GC-rich regions. (Selected for evolutionarily?)

LINES do not appear to follow same selection
Found genes for many non-coding RNAs:
497 tRNAs - mostly clustered
rRNAs not sequenced, because they occur as ~150 tandem repeats (repeats avoided
in selection of BACs for sequence)
snRNAs and snoRNAs
Relatively easy for bacteria, where there are (almost) no introns
In that case, one looks for open reading frames (ATG-to-STOP) of a threshold size
ORFs can be evaluated for use of preferred codons and ribosome binding sites
Eukaryotes harder because of introns, fewer clues as to
which ATG is right one (use 1st AUG of mRNA)
Yeast and C. elegans genomes fairly straightforward because introns fairly short
Known human genes have longer introns and more of them
First looked for known genes in RefSeq database (non-redundant database of human
cDNAs)
Of 10,272 cDNAs, 9212 (92%) could be aligned, at least in part, with genomic
sequence
85% could be aligned over the majority of their sequence
16% aligned in more than one location, possibly signs of pseudogenes or paralogs
(genes duplications that may serve another function)
Got complete alignment of 5364 genes
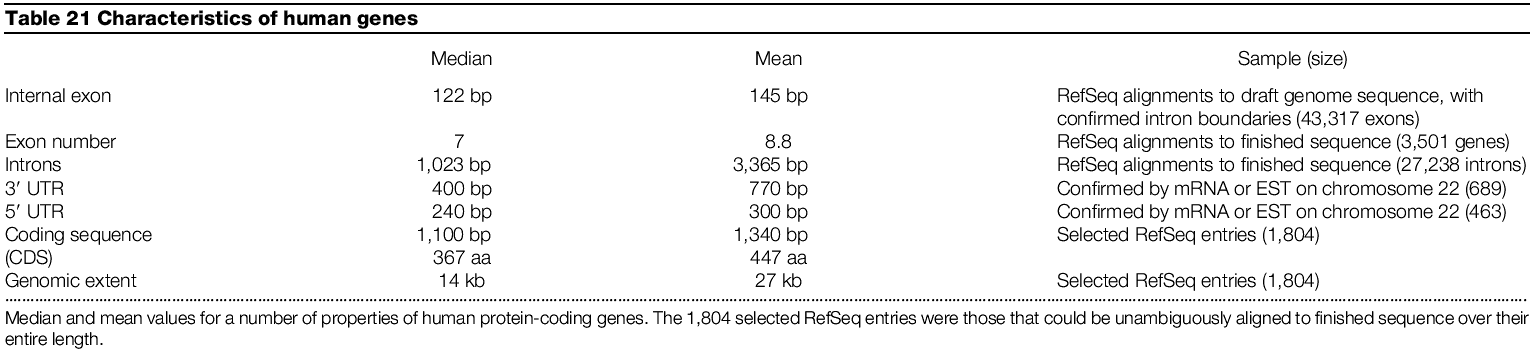
Were able to calculate size and number of introns, exons, and UTR (untranslated regions of mRNA)

Peak exon size similar for human, fly and worm, but tail of distribution longer for fly and worm, so mean exon size is smaller for human. But conservation of peak size suggests optimal size of exon aids in processing mRNA.
Peak intron size is larger and more variable for humans (peak is 87, but mean is 3300bp)

Variation in intron size seems to be related to GC-content of genomic DNA
Exons sizes are constant throughout genome, but intron sizes are longer in AT-rich DNA regions
Were able to map splice sites by comparison to cDNA
Found 98% of 53,000 slice sites followed canonical GT-AG pattern for introns
(GT at 5' end of intron, AG at 3' end)
0.76% use related GC-AG
only 0.1% use AT-AC, which requires variant snRNPs for splicing
Remaining 1% don't fit any particular rule and may be alignment or sequencing
errors
Can try to identify coding regions and exons in genomic DNA using programs which utilize hidden Markov models (HMM), statistical models combing information on splice sites, codon bias, and lengths of introns and exons
Used Ensemble and Genie programs
Ensemble uses prediction of Genescan (an HMM program), then checks these predictions
against ESTs, mRNAs and protein motifs in known databases
Merged these predictions (35,500) with those from Genie, which tries to match
5' end ESTs with 3' end ESTs to make full-length predictions
Also merged with known sequences from RefSeq
Came up with total of 31778 predicted
14,882 from known genes
12,839 from Ensemble
4,057 from Ensemble-Genie
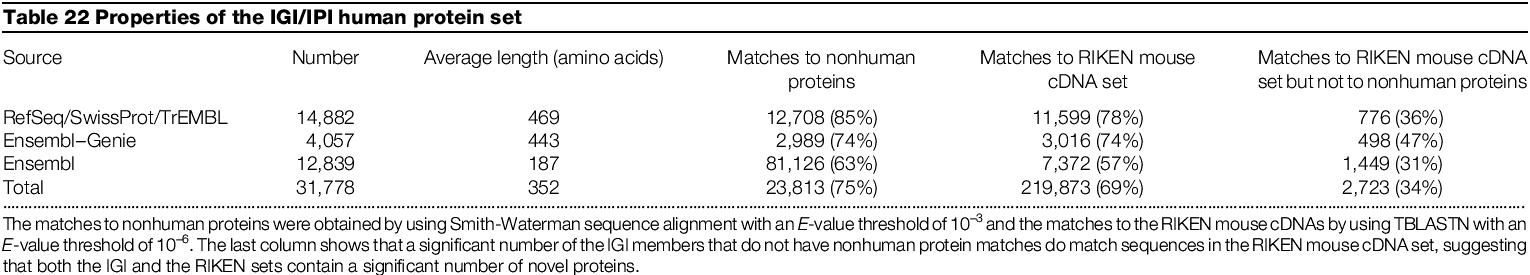
Matches to mouse cDNAs which do not match known proteins may indicate proteins of novel function previously not identified
Comparison of protein coding capacity of sequenced genomes (proteomes)
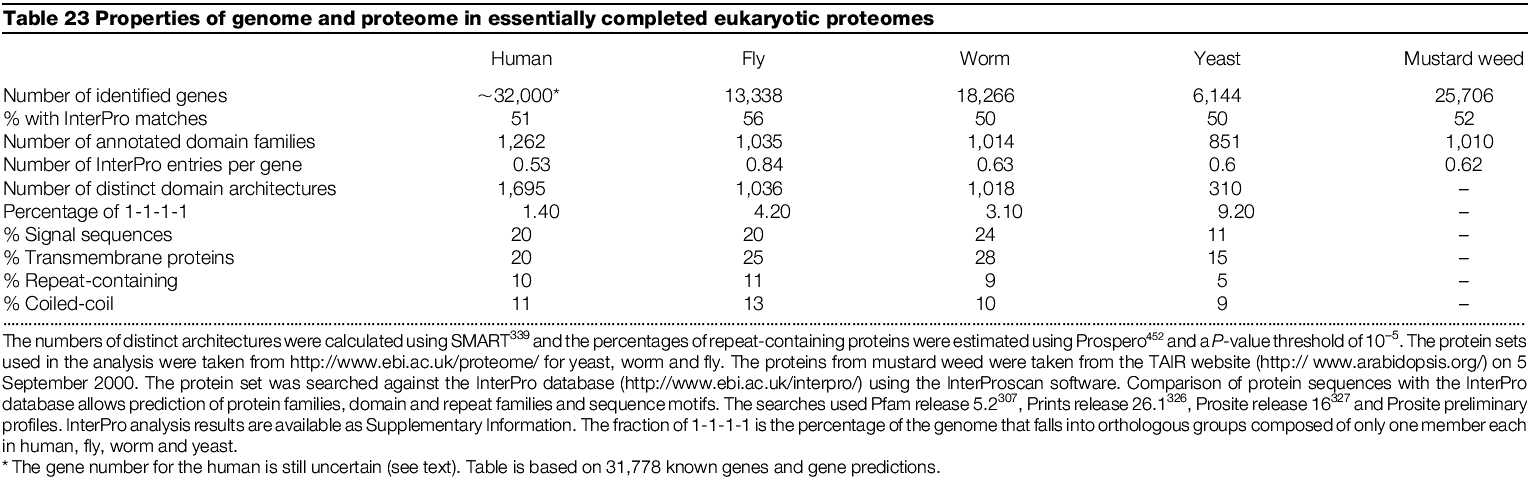
There appear to be about twice as many proteins encoded by humans than fly
or worm
Arabidopsis appears closer to humans in complexity
The difference in proteome size of humans vs flies and worms was surprisingly
low
Estimates of number of human genes had ranged from 35,000 to 150,00 based on
ESTs and other calculations. Conservative estimates appear to have been the
most accurate.

Found distribution of proteins that could be traced to evolutionary ancestors by doing BLASTP search of all proteins against known sequences. Included scores with E< 0.001.
Found 233 genes that were similar to bacterial proteins, but not worm, fly
or yeast.
Not due to DNA contamination, because not exact match to bacterial sequence
(which were filtered out of sequence before assembly)
Confirmed presence of 35 by PCR
Found orthologs (proteins of apparent similar function in other organisms) in
other vertebrates for many
So these appear to be cases of horizontal transfer of genes from bacteria to their vertebrate host.
Humans appear to have not so many more types of genes, but more members of similar gene families
Compared human gene locations to those for mouse known so far from mouse genome project

Found that some chromosomes were essentially same arrangement in rodents and humans. Others are greatly rearranged. Rodents are believed to have accelerated rearrangements in their genomes compared to most mammals
Gives comparitive mammalian genome analysis.
Helps to identify genes and exons from human genome initially missed
Provides sequence information for mammalian model organism.
Some highlights:Mouse genome 2.5 Gb vs human 2.9 Gb (more deletions in rodents)
Can identify regions of synteny between mouse and human for 90% of genome.
Both genomes have ~30,000 genes
99% of mouse genes have a human homolog (and vice versa)
80% of genes, the best match in human genome has that the same mouse gene as its best match (ie, they are orthologs)
Some genes appear to have evolved more quickly than random chance (immunity and reproduction).
Key to assembling sequence:
A key hurdle in assembling sequence is avoiding misalignments caused by repeated sequences in the genome and chimeric clones.
Either of these problems can result in assembling connecting sequences from different regions in the genome together.
Repeated sequences were screened by removing known repeated sequences
Also, unknown repeats indicated by over representation of particular sequences
Unique sequences were then assembled and oriented using mate-pair information
Sequence scaffolds could be assembled based upon distances between pairs of
reads
The initial scaffold covered 73% of the genome additional gaps were filled using
reads which showed homology to scaffolds at one end
Additional gaps were filled with known sequence from the public database
Sequence scaffolds were mapped to chromosome by homology to known chromosome
markers
Completeness was assessed by comparison
to known finished sequences for chromosome 21 and chromosome 22 completeness
was better than 95%
Accuracy will was determined by comparison to known chromosome 21 and chromosome
22 sequences and estimated at 99.96%
Genes were detected by homology searches
of protein databases and expressed sequence tags the total number of genes estimated
between 25 and 30 thousand
Genes are found associated with GC rich sequences
Genes tend to cluster and desert regions > 500 kilobases have been found
without genes
CpG islands also correlates with gene locations
A number of gene duplications caused by a retrotransposition were detected
These are genes which have only a single exon flanked by repeated sequence and
homologous to known multi-exon genes
Chromosome duplications were detected
by concatenation of predicted protein sequences for each of the 24 chromosomes
and searching by homology between chromosomes
Clusters of related genes on different chromosomes were indicative of ancient
chromosomal duplications most appeared to have occurred before the divergence
of primate and rodent lineages
Duplicated genes which are related to genes of known function are interesting
candidates for further study
Nearly 50% of the predicted genes are of unknown function