Auditory transduction
Introduction
The physics of sound
Sound is generally considered to have three physical attributes: frequency, strength or intensity, and quantity.
Intensity
Intensity is the attribute of a sound that allows it to be ordered on a scale from quiet to loud. Sound intensity is also known as sound pressure, sound power or sound strength. It is usually measured as the sound pressure level or SPL in decibels. Let’s unpack that.
A decibel is one tenth of a bel. A bel is the ratio of the absolute measure of power or intensity to a reference value. For sound pressure level, the reference value is the threshold of human hearing. The ratio is measured logarithmically, so that an increase of 10 db means that intensity has increased 100 times. The ‘thermometer’ below plots some common sounds on a deciBel scale in terms of their loudness. There are many others that you can find by googling “db scale hearing”:
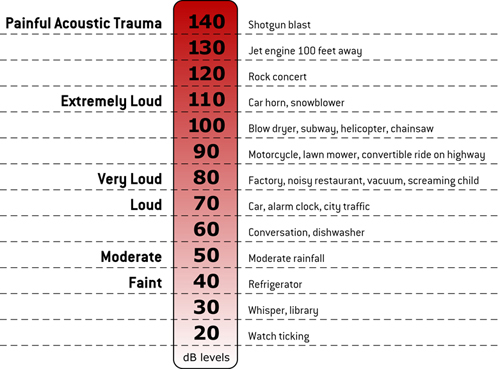
Fig. 38 The intensity of some common sounds in dB.
Quantity
The quantity of a sound is how long it lasts. It is measured in seconds. And that is all there is to say about it.
Summary
Attribute |
Unit |
|---|---|
Frequency |
hertz (cycles per second) |
Quantity |
second |
Intensity |
SPL db |
The psychology of sound
Even though sound is measured physically in three ways, it is perceived in at least six: pitch, loudness, phase, direction, distance, and timbre. We touch on each.
Pitch is the perception of a sound as being high or low and comes from its frequency, so the two are used interchangeably.
From the ear to the cochlear nerve
Transduction of sound to neural impulses in the ear
The human ear is divided into outer, middle & inner pieces:
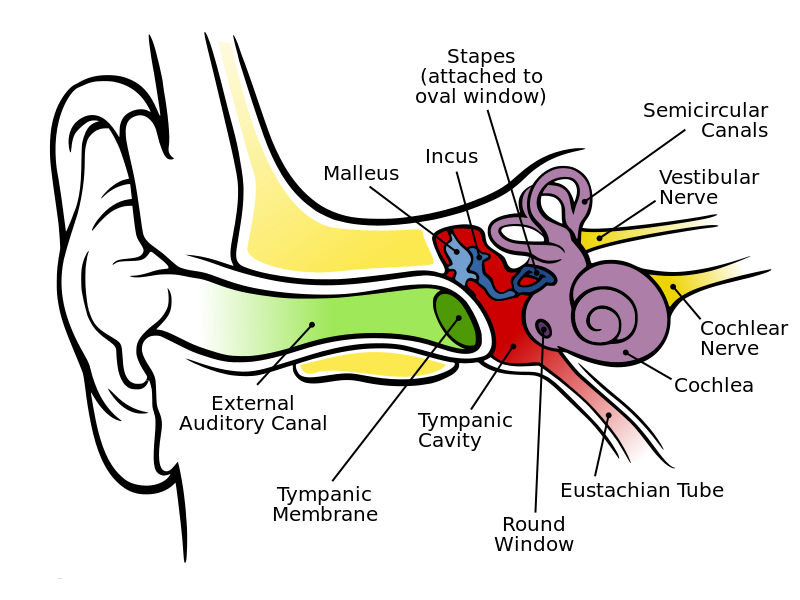
Fig. 39 Anatomy of the human ear
The semicircular canals register the effect of gravity and motion and send it to the brain along the vestibular nerve, but this is not relevant to our interests. Everything else is, and is explained in the next few sections.
The outer and middle ear
The visible part of the ear or pinna collects the changes in air pressure that carry sound and funnel them down the external auditory canal to the tympanic membrane or ear drum. The ear drum vibrates in response, which in turn moves three tiny bones (the ossicles: malleus, incus and stapes) in the Eustachian tube in succession. The end of the stapes, known as its footplate, presses onto the oval window of the snail-shaped, fluid-filled cochlea.
This round-about mechanism for the transmission of vibrational energy from air to the cochlea at first glance seems over-designed and prone to failure. Yet further scrutiny reveals the reason for such complexity. The surface of the tympanic membrane is several times larger than that of the stapes’ footplate, so the ossicles concentrate vibrational energy on it. The lengthened end of the incus acts as a lever in transmitting force to the stapes, which also concentrates the vibrational energy on the oval window. Thus the middle ear acts as a mechanical amplifier, so that by the time sound waves reach the organ of Corti, their amplitude is twenty-two times greater than that of the air impinging on the pinna.
The inner ear and cochlea
As the footplate of the stapes presses on the oval window at the base of the cochlea, it pressurizes the fluid in the scala vestibule or vestibular canal, a channel that runs the length of the cochlear spiral. Given that the cochlea is a closed system, this pressure has to be dissipated somehow, or the stapes footplate would be pushing an incompressible fluid against the unyielding walls of the cochlea. It would rebound back against itself, undoing the transfer of energy down the ossicular chain.
As a first approximation, what happens is that pressure bows the inner wall of the vestibular canal, which in turn bows the inner wall of a channel on the other side, the scala tympani or tympanic canal. Pressure so-transferred to the tympanic canal runs down the cochlea and bows the round window, a flexible membrane at the base of the cochlea. Since the round window does not impinge on anything else, its winds up absorbing whatever pressure is left, effectively draining it from the system. Fig. 40 attempts to depict this transfer of energy up one channel and down its twin on the other side:

Fig. 40 Pressure equalization within the cochlea
Redrawn from https://en.wikipedia.org/wiki/File:Cochlea.svg
Thus energy is conserved within the closed system of the cochlea, making Isaac Newton happy.
The basilar membrane and tonotopic mapping
All of this is to get you to the point of understanding what happens to the strip of tissue that separates the vestibular and tympanic canals and thus bends with the transfer of pressure from one side to the other. Known as the basilar membrane, it is fixed at the base of the cochlea and free to move at the apex. Any vibration impinging on it creates what is known as a traveling wave. You have probably created a traveling wave yourself. Imagine that you want to shake out a wet towel. You grasp it with both hands across a narrow end, and give it a shake. A wave runs down it from your hands to the end. That is a traveling wave. It is much more readily appreciated in a moving one, of which the Internet affords us a rich selection, such as the general one at Wikipedia’s Periodic travelling wave or the particular one created on the basilar membrane at Mammano & Nobili’s Cochlea site.
There is one way in which the basilar membrane is very different from a towel, however. A towel is of uniform width and stiffness throughout its length. The basilar membrane is not; it is narrower and stiffer at the base, and wider and more flexible at the apex. This is much easier to grasp if the cochlea is uncoiled into a straight tube, as in the figure below:
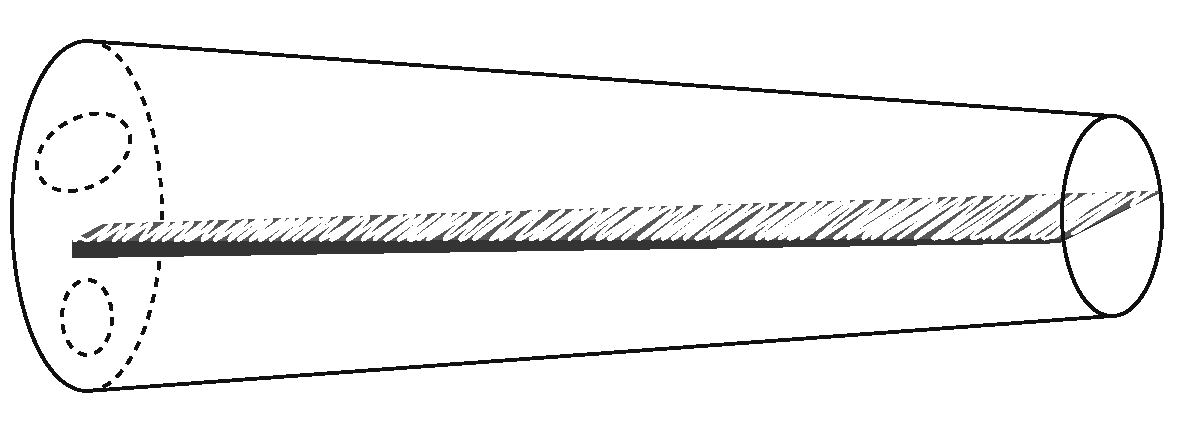
The result is that the basilar membrane’s elasticity decreases with distance from the base. A specific frequency of vibration thus preferentially resonates at a specific distance from the base, as elucidated in the 1940s by von Békésy (1960), for which work he received a Nobel Prize. To compare it to a musical instrument, the basilar membrane is played by acoustic energy much like a xylophone:
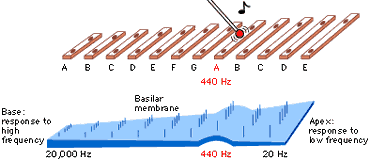
Fig. 42 The basilar membrane as a xylophone
This fixed array of frequency sensitivity down the length of the cochlea is know as tonotopy or a frequency-to-place mapping. A rough spectrum of frequency sensitivity is given for the uncoiled cochlea in Fig. 43. For humans, it ranges from around 20 Hz to 20 kHz:
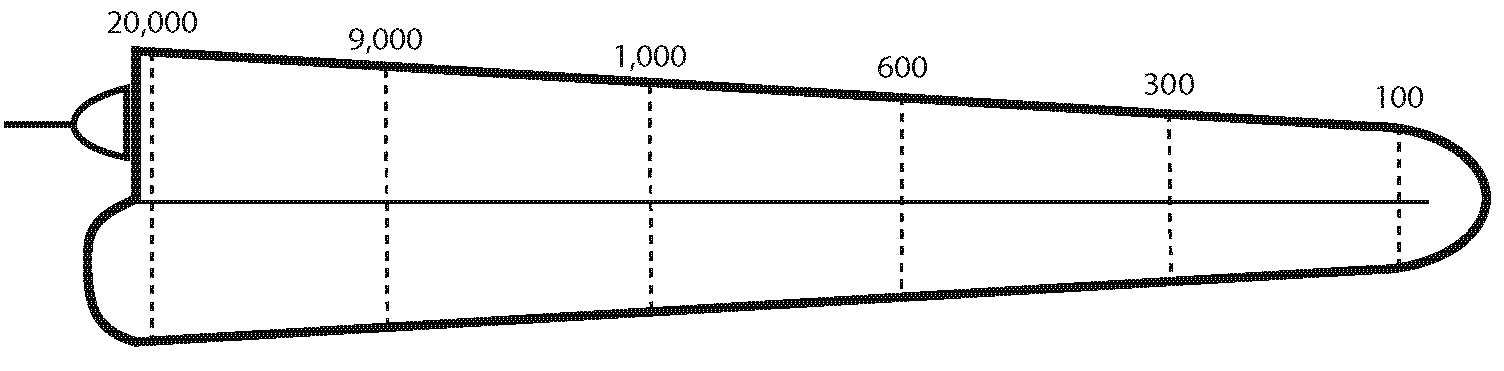
The horizontal line running along the middle of the figure represents the basilar membrane. This image adds the stapes impinging on the oval window in the top left, and the round window bowing outwards underneath it. Fig. 44 coils the tube back up to shows how the various cross-sections of a coiled cochlea are sensitive to specific frequencies:
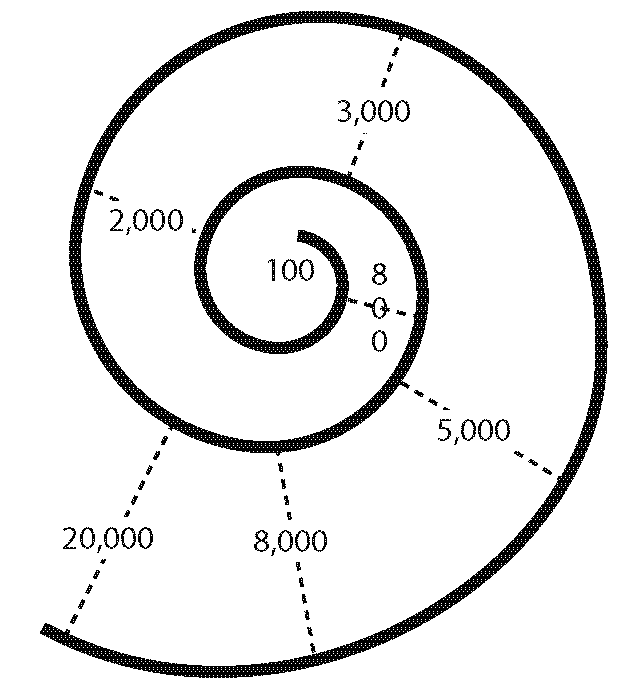
I hope you can see that the highest frequencies are registered at the base of the cochlea and gradually diminish towards the apex.
The organ of Corti
The basilar membrane is housed within a larger structure called the organ of Corti, the most mechanically complex structure in the human body (Reichenbach & Hudspeth 2014). Its location between the vestibular and tympanic channels is depicted in Fig. 45:
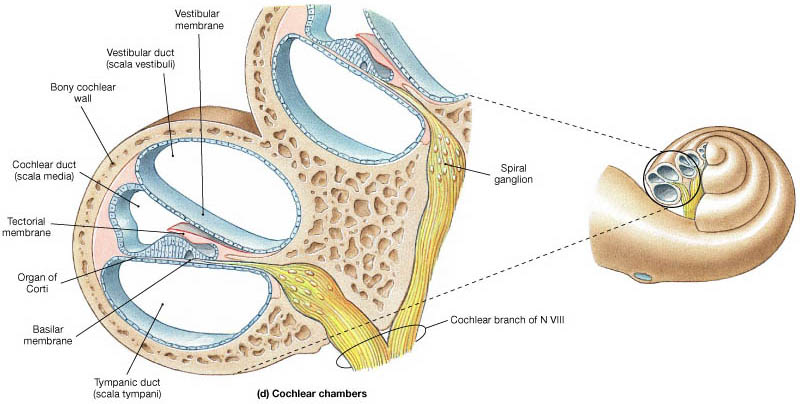
Fig. 45 The organ of Corti in a cross-section of the cochlea.
The organ of Corti is designed like a sandwich, with the basilar membrane as the bottom slice of bread and the tectorial membrane at as the top slice. Between the two are hair cells, as seen in this close-up. On the left are three outer hair cells; on the right is a single inner hair cell:
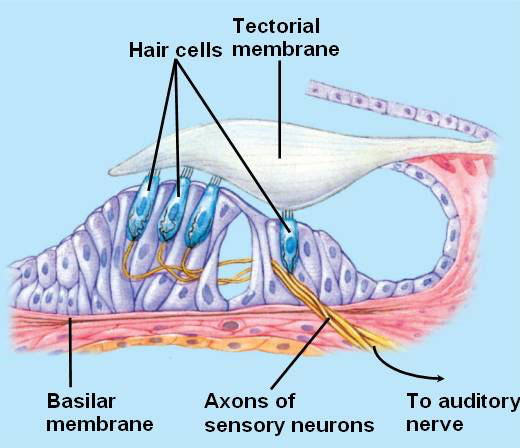
Fig. 46 Organ of Corti, close-up
The top of a hair cell is crowned with a tuft of protein filaments termed stereocilia, arrayed somewhat like a pipe organ in this photograph from an electron microscope:
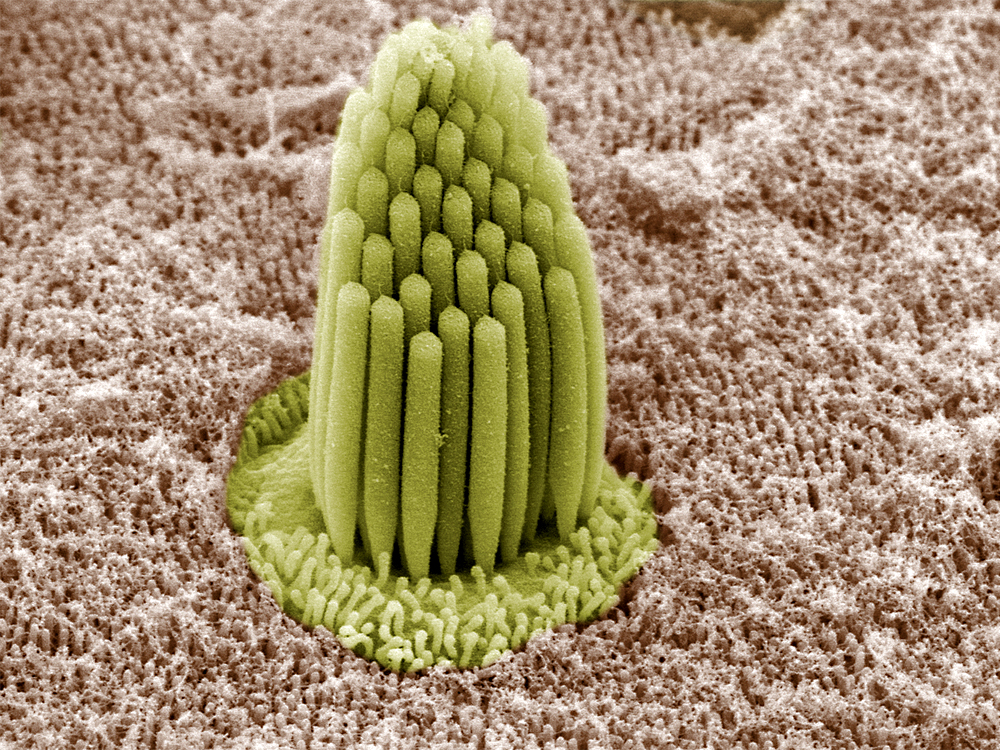
Fig. 47 A close-up of a bundle of stereocilia
source: Leonardo Andrade and Bechara Kachar, NIDCD/NIH, abovethemessycloud.blogspot.com
Question
What could the purpose of this lovely ‘organ pipe’ structure be? You have to imagine how the tips of the steocilia make contact.
When the basilar membrane bends under the influence of a sound wave, the hair cells brush up against the tectorial membrane. The next image tries to depict this by means of arrows in the direction of movement:
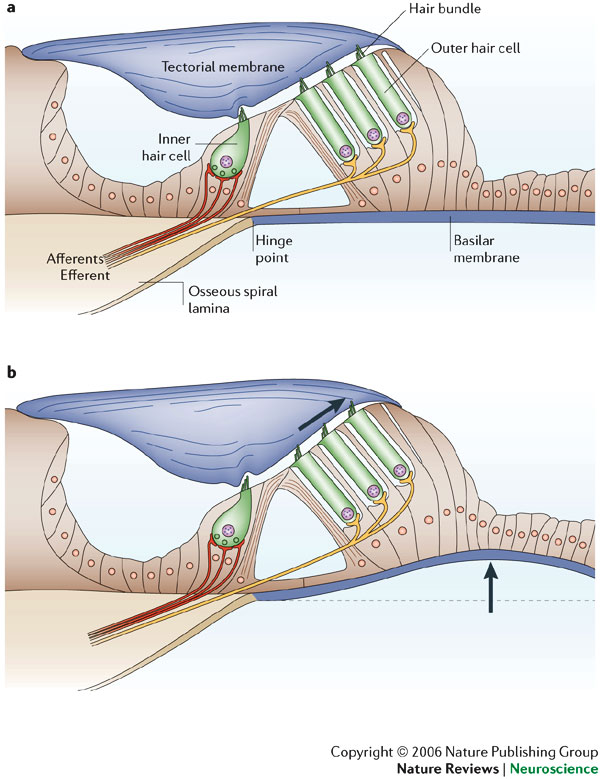
Fig. 48 Bending of basilar membrane translated to stereocilia tips
The bending of the stereocilia opens pores at their tips which allows positively charged potassium ions (\(K^+\)) to enter and depolarize the cell. This receptor potential opens voltage-gated channels which allow calcium ions (\(Ca^2+\)) to enter the cell and trigger the release of neurotransmitters at the bottom of the cell. This process is summarized in the next diagram:
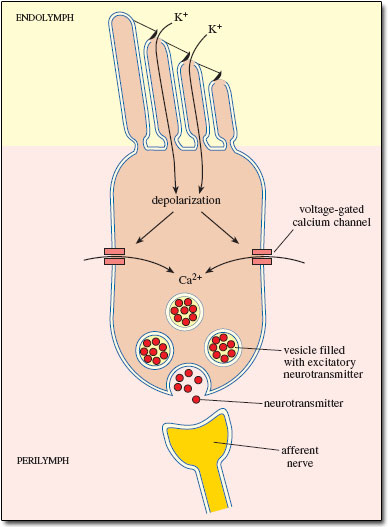
Fig. 49 Inner hair cell depolarization
The neurotransmitters diffuse across the narrow space between the hair cell and a cochlear nerve terminal, where they then bind to receptors and thus trigger action potentials in the nerve. In this way, an inner hair cell acts as mechanoreceptor that transduces vibrational into electrical energy.
Tuning curves of hair cells
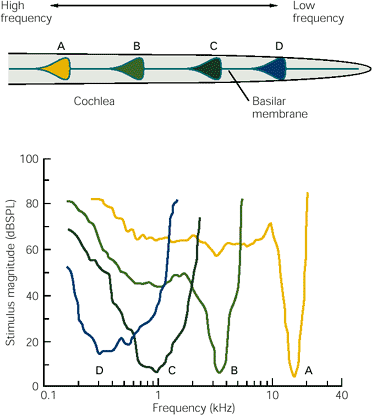
The discussion so far suggests that hair cells are exquisitely tuned to a single frequency, but we have not taken into account the intensity of sound. It turns out that a hair cell is most discriminating only for quiet sounds:
The drawing in the top half of the image shows four frequencies that peak at segments A to D of the basilar membrane. The graph in the bottom half measures the response of a hair cell that is closely tuned for each frequency. The x-axis measures frequency logarithmically; the y-axis measures intensity in db SPL. The four curves are roughly V shaped. By way of example, the yellow, high-frequency curve has its sharpest response at something like 5 dbSPL; its sensitivity gradually gets broader (less precise) until it hits about 60 db SPL, when it essentially collapses and starts responding to almost any frequency. Note that as the frequency gets lower, a cell’s tuning gets broader.
This raises two problems. At low intensity, the basilar membrane barely moves so the stereocilia are subject to random motions in the fluid surrounding them, potentially producing neurotransmitter discharges to sounds that are ‘not there’. The other is, how is frequency perceived at high intensities, if hair cells practically lose their specific tuning? The first question is answered in the next section.
Outer hair cells
The earliest mammals were nocturnal shrew-like creatures which lived on the forest floor eating insects and grubs, for which they needed keen senses of smell and hearing. Jeholodens jenkinsi is a tricondant that is very similar to what they looked like.
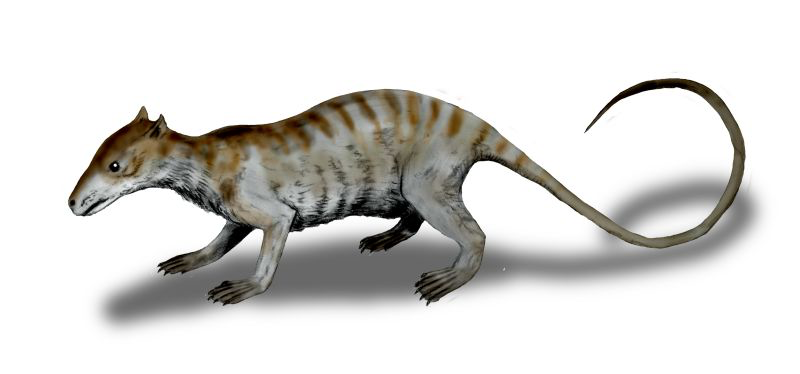
source: https://commons.wikimedia.org/wiki/File:Jeholodens_BW.jpgI would like to go off-track for a moment, to ask you this question:
Question
What is a reflex?
Well, Wikipedia, quoting the inestimable source of Purves (2004), says …
A reflex action, differently known as a reflex, is an involuntary and nearly instantaneous movement in response to a stimulus.
I have no argument with that, but as a cognitive scientist, I take a reflex to be an action that is beyond my favorite parcel of cognition, namely learning. Which brings me to outer hair cells.
If what rocks your world is rock and roll, watch this short video. If your taste is more classical, watch this one. Either way, you should see how the top of the cigar-shaped object in the center of the screen vibrates in time to the music.
What you are seeing is an isolated outer hair cell. It moves. In fact in moves in such a way as to exaggerate the movement of the basilar membrane, much like a person on a swing trying to make it swing higher:
if a person sitting on a swing (basilar membrane) pumps his legs (outer hair cell), the amplitude of the swing motion is increased in response to a push (sound stimulus). (source)
The following image attempts to put this into a cycle of static pictures. OHC stands for outer hair cell, IHC stands for inner hair cell, and AP stands for action potential:
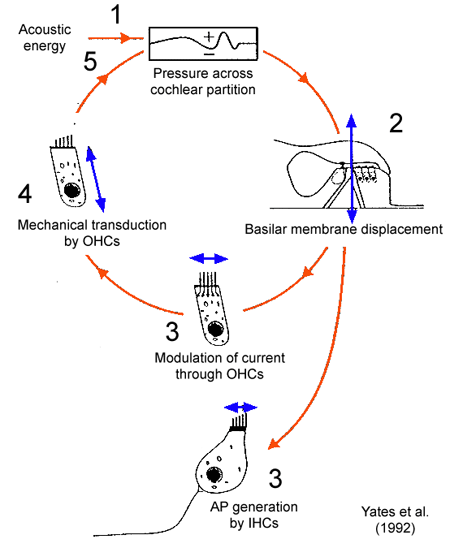
Fig. 51 Outer hair cells
This pumping makes faint sounds easier to register on the basilar membrane. Reptiles do not have outer hair cells, so they appear to be an innovation in the mammalian lineage.
The pumping effect of the outer hair cells is also an apt example of a reflex, since it is “an involuntary and nearly instantaneous movement in response to a stimulus” and is beyond the reach of learning.
Summary
This chapter sketches the transduction of sound to action potentials in the ear. It can be divided into two sequences, the mechanical transmission of acoustic energy and then its transduction to electrical energy:
sound waves → tympanic membrane (ear drum) → malleus → incus → stapes → oval window → vestibular canal → basilar membrane →
stereocilia of hair cells → potassium ions → calcium ions → neurotransmitters → action potentials over cochlear nerve
This seems frightfully complicated, yet it works. In fact, it works quite well.
The three characteristics of sound
The sequence summarized above can be boiled down to the following diagram:
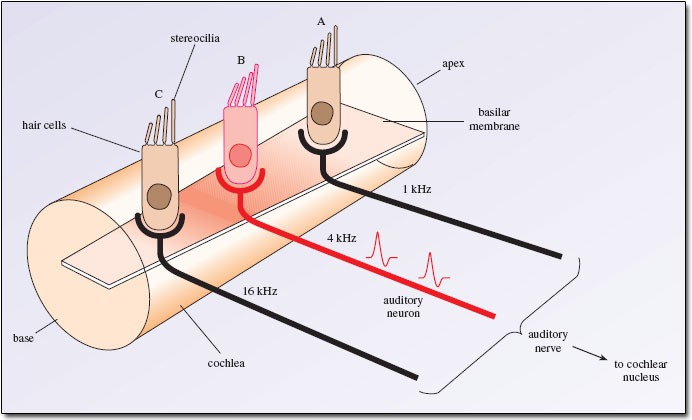
Fig. 52 Hair cells along the basilar membrane
Think back to the concept of tonotopy: the long axis of the basilar membrane encodes frequency, so its position on the basilar membrane endows each inner hair cell with the ability to respond to a different frequency, and this response is carried forward by the auditory nerve. Since the stereocilia only open potassium pores as long as they are bent, a hair cell only produces neurotransmitters for as long as the frequency lasts. In this way, the duration of the sound is also carried forward by the auditory nerve.
Finally, recall that I asked you in reference to Fig. 47 what the purpose could be of the exotic ‘pipe organ’ shape of the stereocilia. Imagine the difference in contact between a faint sound and a loud sound. For a faint sound, the basilar membrane barely moves, so only the tallest stereocilia brushes up again the tectorial membrane and so only opens its few potassium pores and ultimately producing just a handful of action potentials. On the other hand, for a loud sound, the basilar membrane moves brusquely, forcing all the stereocilia up again the tectorial membrane and so opening all the potassium pores. This produces a cascade of action potentials. This is how the intensity of a sound can be transduced to the auditory nerve. This called a rate code, because the rate of firing of action potentials is proportional to the intensity of the sound.
These three aspects of sound transduction are the physical grounding of the cognitive attributes of sound, especially linguistic sounds. They warrant their own table:
Physical |
Coding |
Cognitive |
|---|---|---|
quantity |
implicit in duration of spike trains |
duration |
frequency |
frequency to place or tonotopic |
tone |
intensity |
rate (of action potential firing) |
loudness |
References
Purves (2004). Neuroscience: Third Edition. Massachusetts, Sinauer Associates, Inc.
Pickles JO. 1988. An Introduction to the Physiology of Hearing, 2nd ed. New York: Academic.
von Békésy (1960)
Reichenbach, T., & Hudspeth, A. J. (2014). The physics of hearing: fluid mechanics and the active process of the inner ear.
Not integrated yet: Feinberg, Todd E., and Jon Mallatt. “The evolutionary and genetic origins of consciousness in the Cambrian Period over 500 million years ago.” Frontiers in psychology 4 (2013).