Salem Accusations and Executions

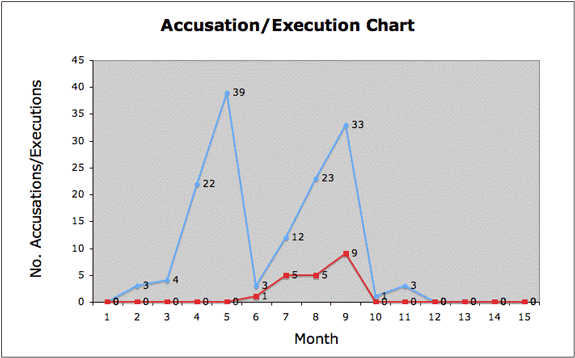
A line chart shows change by connecting value data for variables at different data points. Specifically, this chart shows how changes in the number of accusations each month relate to changes in the number of executions each month during 1692.
To make a line chart of accusations and executions, download the Line Chart Data Set. (Alternatively, users can copy into a new worksheet both the "Number of Accusations" column from the Scatter Plot Data Set and the "Number of Executions" column from the Execution Scatter Plot Data Set.)
The Line Chart Data Set consists of two columns (variables):
- The number of accusations each month of the Salem outbreak, beginning with January 1692 (1).
- The number of executions each month, beginning with January 1692 (1).
To construct a line chart, select "Chart" from the Insert Menu. Select "Line" as the chart type, and "line with markers displayed at each data value" as sub-type. Click "Next" and then click the "data range" box. Drag the mouse over the two columns (include column headings) and click the small "data range" box again. Click "Next" to edit the chart and select its location. Click "Finish." (The completed chart may be further edited by selecting "Chart Options" from the Chart Menu.)
The line chart illustrates the relationship of accusations and executions in 1692. It draws attention to the establishment of the Court of Oyer and Terminer, which conducted its first trial and execution in June 1692. Prior to June, although the number of accused witches accelerated, not a single execution took place. The low number of accusations and executions in June was doubtless due to the temporary suspension of the Court of Oyer and Terminer following Bridget Bishop's hanging. However, once the Court resumed its deliberations, the chart reveals that accusations and executions marched in tandem throughout July, August, and September, climaxing in September 1692, with thirty-three recorded accusations and nine executions. The sudden and dramatic decline of both accusations and executions in October shows that to a substantial degree, the Salem witch hunt had come to an end.
During its lifetime, however, Salem Witchcraft was chronologically extensive, spreading over the Massachusetts countryside in two waves. Which communities were involved and when? Click Next.