EENS 211

Earth Materials

Tulane University

Prof. Stephen A. Nelson

Mineral Stability and Phase Diagrams


As we discussed previously, there are four major processes by which minerals form.  Each of these occurs within a limited range of environmental conditions. First, the chemical ingredients must be present, and second, the pressure and temperature conditions must be right.  Let's first review these mineral forming processes and the pressure temperature conditions necessary.
  • Precipitation from a fluid like H2O or CO2.  
    • Hydrothermal Processes - T = 100 - 500oC, P = 0 to  1000 MPa (10 kb) 

    • Diagenesis - T = 0 - 200oC, P = 1 atm - 300 MPa (3kb)

    • Evaporation - T = 10 - 40oC, P = 1atm

    • Weathering - T = 10 - 100oC, P = 1 atm - 10 MPa (0.1 kb)

    • Biological activity - T = 10 - 40oC, P = 1atm - 1Mpa.(0.01kb)

  • Sublimation from a vapor.  This process is somewhat more rare, but can take place at a volcanic vent, or deep in space where the pressure is near vacuum. T = 0 - 500oC, P = 0 - 1 atm.


  • Crystallization from a liquid.  This takes place during crystallization of molten rock (magma) either below or at the Earth's surface. Results in igneous rocks, T = 600 - 1300oC, P = 1atm - 3,000 MPa (30kb).


  • Solid - Solid reactions.  This process involves minerals reacting with other minerals in the solid state to produce one or more new minerals. 

    •  Diagenesis -  T = 100 - 200oC, P = 1 atm - 300 MPa

    • Metamorphism - T = 200oC - melting T, P = 300 - 1000 MPa

Thus, for any given system we can define temperature, pressure, and compositional variables that determine what minerals are stable.  An understanding of mineral stability is essential in understanding which minerals form, and allow us to determine the conditions present when we encounter minerals in the Earth.  


Recall from your physical geology course that both temperature and pressure vary with depth in the Earth.  Pressure is related to depth because pressure is caused by the weight of the overlying rocks.  The way that pressure and temperature vary in the Earth is called the Geothermal Gradient.  
The average, or sometimes called normal, geothermal gradient in the upper part of the Earth is about 25oC/km.  But, the geothermal gradient can vary from 200oC/km in areas where hot igneous bodies are intruding at shallow levels of the crust to 10oC/km, in areas like subduction zones where cold lithosphere descends back into the mantle.

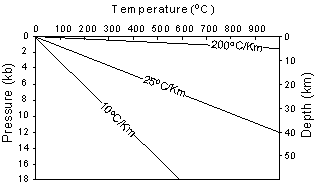
Geothermal gradients deeper in the earth become much lower than those near the surface.

Phase Diagrams

A phase diagram is a graphical representation of chemical equilibrium. Since chemical equilibrium is dependent on the composition of the system, the pressure, and the temperature, a phase diagram should be able to tell us what phases are in equilibrium for any composition at any temperature and pressure of the system. First, a few terms will be defined.

Definitions

System - A system is that part of the universe which is under consideration. Thus, it may or may not have fixed boundaries, depending on the system. For example, if we are experimenting with a beaker containing salt and water, and all we are interested in is the salt and water contained in that beaker, then our system consists only of salt and water contained in the beaker.

If the system cannot exchange mass or energy with its surroundings, then it is termed an isolated system. (Our salt and water system, if we put a lid on it to prevent evaporation, and enclosed it in a perfect thermal insulator to prevent it from heating or cooling, would be an isolated system.)

If the system can exchange energy, but not mass with its surroundings, we call it a closed system. (Our beaker, still sealed, but without the thermal insulator is a closed system).

If the system can exchange both mass and energy with its surroundings, we call it an open system. (Our beaker - salt - water system open to the air and not insulated is thus an open system).

Phase - A phase is a physically separable part of the system with distinct physical and chemical properties. A system must consist of one or more phases. For example, in our salt-water system, if all of the salt is dissolved in the water, consists of only one phase (a sodium chloride - water solution). If we have too much salt, so that it cannot all dissolve in the water, we have 2 phases, the sodium chloride - water solution and the salt crystals. If we heat our system under sealed conditions, we might have 3 phases, a gas phase consisting mostly of water vapor, the salt crystals, and the sodium chloride - water solution.

In a magma a few kilometers deep in the earth we might expect one or more phases. For example if it is very hot so that no crystals are present, and there is no free vapor phase, the magma consists of one phase, the liquid. At lower temperature it might contain a vapor phase, a liquid phase, and one or more solid phases. For example, if it contains crystals of plagioclase and olivine, these two minerals would be considered as two separate solid phases because olivine is physically and chemically distinct from plagioclase.

Component - Each phase in the system may be considered to be composed of one or more components. The number of components in the system must be the minimum required to define all of the phases. For example, in our system salt and water, we might have the components Na, Cl, H, and O (four components), NaCl, H, and O (three components), NaCl and HO (two components), or NaCl-H2O (one component). However, the possible phases in the system can only consist of crystals of halite (NaCl), H2O either liquid or vapor, and NaCl-H2O solution. Thus only two components (NaCl and H2O) are required to define the system, because the third phase (NaCl - H2O solution) can be obtained by mixing the other two components.

The Phase Rule

The phase rule is an expression of the number of variables and equations that can be used to describe a system in equilibrium.  In simple terms, the number of variables are the number of chemical components in the system plus the extensive variables, temperature and pressure.  The number of phases present will depend on the variance or degrees of freedom of the system.  The general form of the phase rule is stated as follows:

F = C + 2 - P

where F is the number of degrees of freedom or variance of the system.

C is the number of components, as defined above, in the system.

P is the number of phases in equilibrium,

and the 2 comes from the two extensive variables, Pressure and Temperature.

To see how the phase rule works, let's start with a simple one component system - the system Al2SiO5, shown in the Pressure, Temperature phase diagram below.

First look at the point in the field of kyanite stability.  Since kyanite is the only phase present, P=1.  F is 2 at this point, because one could change both temperature and pressure by small amounts without affecting the number of phases present. We say that this area of kyanite stability on the phase diagram is a divariant field (variance, F =2).

Next look at the point on the phase boundary between kyanite and sillimanite.   For any point on such a boundary the number of phases, P, will be 2.  Using the phase rule we find that F = 1, or there is one degree of freedom.  This means there is only one independent variable.

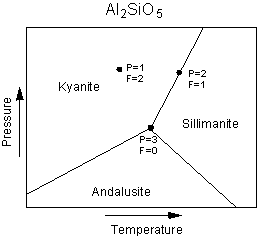
If we change pressure, temperature must also change in order to keep both phases stable.  The phase assemblage is said to be univariant in this case, and the phase boundaries are univariant lines (or curves in the more general case.

Finally, we look at the point where all three univariant lines intersect.  At this point, 3 phases, kyanite, andalusite, and sillimanite all coexist at equilibrium.  Note that this is the only point where all three phases can coexist.   For this case, P=3, and F, from the phase rule, is 0.  There are no degrees of freedom, meaning that any change in pressure or temperature will result in a change in the number of phases.  The three phase assemblage in a one component system is said to be invariant.


Equilibrium and Thermodynamics

Although the stability relationships between various phases can be worked out using the experimental method, thermodynamics gives us a qualitative means of calculating the stabilities of various compounds or combinations of compounds (mineral assemblages).  We here give an introductory lesson in thermodynamics to help us better understand the relationships depicted on phase diagrams.

The First Law of Thermodynamics states that "the internal energy, E, of an isolated system is constant". In a closed system, there cannot be a loss or gain of mass, but there can be a change in energy, dE.  This change in energy will be the difference between the heat, Q, gained or lost, and the work , W done by the system.  So,

dE = dQ - dW                 (1)

Work, W, is defined as force x distance.  Since Pressure, P, is defined as Force/surface area, Force = P x surface area, and thus W = P x surface area x distance = P x V, where V is volume.  If the work is done at constant pressure, then W = PdV.  Substitution of this relationship into (1) yields:

dE = dQ - PdV                 (2)

This is a restatement of the first law of thermodynamics. 

The Second Law of Thermodynamics states that the change in heat energy of the system is related to the amount of disorder in the system.  Entropy is a measure of disorder, and so at constant Temperature and Pressure:

dQ = TdS

Thus, substituting into (2) we get:

dE = TdS - PdV              (3)

The Gibbs Free Energy, G, is defined as the energy in excess of the internal energy as follows:

G = E + PV - TS                         (4)

Differentiating this we get:

dG = dE +VdP + PdV - TdS - SdT

Substituting (3) into this equation then gives:

dG = TdS - PdV + VdP + PdV - SdT - TdS 

or

dG = VdP - SdT     (5)

For a system in equilibrium at constant P and T,  dG = 0.  

If we differentiate equation (5) with respect to P at constant T, the result is:

             (6)          

and if we differentiate equation (5) with respect to T at constant P we get:

           (7)

Equation (6) tells us that phases with small volume are favored at higher pressure, and equation (7) tells us that phases with high entropy (high disorder) are favored at higher temperature.

Equation (5) tells us that the Gibbs Free Energy is a function of P and T.  We can see this with reference to the diagram below, which shows diagrammatically how G, T, and P are related in a system that contain two possible phases, A and B.

In the diagram, phase A has a steeply sloping free energy surface.  Phase B has a more gently sloping surface.  Where the two surfaces intersect, Phase A is in equilibrium with phase B, and GA = GB.  

Next we look at 3 cross-sections through this figure.  In the first, we look a section of G versus T at constant P, such as along the front face of the figure to the right.  

In this section at constant P we see that at temperatures below TE phase A has the lowest Gibbs Free Energy, G.  At these temperatures, phase A is stable and phase B is not stable because it has a higher free energy.  Note that at TE the free energy of the phase A, GA, is the same as the free energy of phase B, GB.  At temperatures greater than TE phase B has a lower free energy than phase A, and thus phase B is stable.
Next, we look at a section of G versus P at constant T.  In this section, GA = GB at PE.  At pressures greater than PE phase B is stable because it has a lower G than phase A.  At pressures less than PE phase A is stable because it has a lower G than phase B.  
Finally, we look at a cross-section across the bottom of the first figure.  Here we project the line of intersection of the Free Energy surfaces onto the P - T plane.  Along the line of intersection of the surfaces GA = GB.  The line separates two fields, one at low P in which A is the stable phase and one at higher P in which phase B is stable.  This is a classic P-T phase diagram.  The line represents all values of P and T where Phase A and Phase B are in equilibrium or where GA = GB.  If the chemical reaction that occurs on this line is:

 A <=> B

 then we can write:

DG = GB - GA = 0

Note that DG is defined as GProducts - Greactants for the chemical reaction as written above.

Taking a similar approach, we can rewrite equation (5), above, as:

dDG = DVdP - DSdT            (8)

Where in general, 

DG = the change in Gibbs Free Energy of the reaction =  SGproducts - SGreactants

DS = the change in entropy of the reaction =  SSproducts - SSreactants

and  DV = the change in volume of the reaction =  SVproducts - SVreactants

At equilibrium, as we have just seen, DG = 0, so from equation (8)

0 = D VdP - D SdT

Rearranging this equation yields

This relation is known as the Clausius - Clapeyron Equation.  It is important  because it tells us the slope of the equilibrium boundary or reaction boundary on a Pressure versus Temperature phase diagram.

We next look at two cases of chemical reactions.  In the first case, the chemical reaction is between only solid phases.  In the second case a fluid or gas is involved as one of the products of the reaction.


Solid - Solid Reactions
A solid-solid reaction only involves the solid phases as both reactants and products, with no fluid phases showing up in the chemical reaction.  Most solid-solid reactions appear as straight lines on Pressure-Temperature diagrams.  The reason for this comes from the Clausius-Clapeyron equation. 

      dP/dT = DS/DV

      where DS = the change in entropy of the reaction =  SSproducts - SSreactants

      and DV = the change in volume of the reaction =  SVproducts - SVreactants

In general, both the entropy, S, and the Volume, V of any phase varies with temperature and pressure.  As temperature increases, both S and V tend to increase (things become more disorganized at high temperature, increasing the entropy and molecules vibrate more at high temperature, increasing the volume).  Similarly, both S and V tend to decrease with increasing pressure (less room to vibrate means better organization and lower volume). In addition, the change in volume and entropy at any given temperature and pressure tends to be small.  The net result of this is that for solid - solid reactions the effects of increasing temperature tend to be offset by the effects of increasing pressure, and thus dP/dT remains more or less constant.  A curve whose slope is constant is a straight line.

Let's use these principles to analyze some solid - solid reactions, such as those in the Al2SiO5  phase diagram.  Note that for the solid-solid reaction Andalusite <=> Kyanite, dP/dT is positive.  This is what we expect, because the product kyanite, occurs on the low T side of the reaction boundary and should have a lower entropy, making DS negative.  Increasing the pressure causes a decrease in volume, so Kyanite should have lower volume than Andalusite and thus  DV is also negative. With both DS and DV megative, the slope of the boundary curve dP/dT is positive.
For the reaction Kyanite <=> Sillimanite, the product Sillimanite occurs on the high T side of the boundary, and thus SKyanite < SSillimanite, so DS is positive.  Since Kyanite occurs on the high P side of the boundary curve, VKyanite < VSillimanite, so DV is also positive.  Thus, dP/dT is also positive.

But, note that the reaction boundary for  Andalusite <=> Sillimanite has a negative slope on the diagram.  The product of the reaction, Sillimanite, has a smaller volume than the reactant Andalusite.  So, DV is negative.  But, Sillimanite occurs on the high temperature side of the reaction and thus has a higher entropy than andalusite.  Thus, since the reactant, andalusite, has a lower entropy then the product, sillimanite, DS is positive, making dP/dT negative.    

These reasons for these relationships become more evident if we note that the main differences between the crystal structures of andalusite, kyanite, and sillimanite are in the way Al+3 ion is coordinated with Oxygen.  Writing the chemical formula for each in terms of coordination of Al:

Kyanite - Al(6)Al(6)SiO5
Andalusite - Al(5)Al(6)SiO5
Sillimanite - Al(4)Al(6)SiO5

where the (6) superscript represents 6-fold or octahedral coordination, the (5) superscript represent irregular 5-fold coordination, and the (4) superscript represents 4-fold coordination. Kyanite should therefore have the lowest volume since it is the most closely packed structure. The Al in irregular 5-fold coordination in Andalusite produces a more open structure than having Al in 4- and 6-fold coordination in Sillimanite, and thus Andalusite has a higher volume than Sillimanite. 

Thus,  VKyanite < VSillimanite < VAndalusite.

and  DV for the reaction Andalusite <=> Kyanite is negative, DV for the reaction Kyanite <=> Sillimanite is positive, and  DV for the reaction Andalusite <=> Sillimanite is negative.

Devolatization Reactions

Unlike sold-solid reactions, devolatilization reactions appear as curves on Pressure - Temperature diagrams.  to see why this is true let's analyze the simple dehydration reaction:

A <=> B + H2O.

For this reaction we can write:

DS = SB + SH2O - SA = DSsolids +SH2O

and

DV = VB + VH2O - VA = DVsolids + VH2O


Increasing temperature will generally cause DS to be positive, especially for this reaction in which a gas or fluid phase is produced, because gases always have a higher entropy (randomness) than solids.  At low pressure DVsolids will generally be negative.  But at low pressure VH2O will be very large, because a fluid or gas will expand to fill space available.  Thus, dP/dT will be positive.  As the pressure increases, the fluid or gas will be more compressible than the solids, so the total DV will become increasingly smaller. Thus, dP/dT will increase. dehydreact.gif (6232 bytes)
Eventually because of the compressibility of the gas or fluid phase, DVsolids becomes equal to VH2O and thus DV of the reaction becomes 0, making dP/dT  infinite.  At pressures above this point, the fluid becomes so compressed that VH2O gets smaller and smaller, making DV for the reaction increasingly negative.  Thus, dP/dT becomes increasingly negative.


Calculation of Reaction Boundaries

Another relationship that is useful is:

G = H - TS

where G is the Gibbs Free Energy, H is the enthalpy, T is the absolute temperature in Kelvin, and S is the entropy.

For a chemical reaction, we can rewrite this as:

DG = DH - TDS                     (10)

where again:

DG = the change in Free Energy of the reaction =  SGproducts - SGreactants

DH = the change in Enthalpy of the reaction =  SHproducts - SHreactants

DS = the change in Entropy of the reaction =  SSproducts - SSreactants

In general DG, DH, DS, and DV are dependent of Pressure and Temperature, but at any given T & P:

If DG < 0 (negative) the chemical reaction will be spontaneous and run to the right,

If DG = 0 the reactants are in equilibrium with products,

and if DG > 0 (positive) the reaction will run from right to left.


Temperature Dependence of G, H, and S

As stated above, G, H, and S depend on Temperature and Pressure.  But, because G depends on H and S, it is usually more convenient to consider the temperature dependence of H and S, so that if we know H and S at any given temperature, we can calculate G.

where Cp is the heat capacity at constant pressure.  The heat capacity is the amount of heat necessary to raise the temperature of the substance by 1o K.

Thus:

or


If Cp is not a function of temperature, then further integration results in:


(Note that in general, Cp is a function of temperature, and the known function of temperature could be inserted before integration, but this introduces complications that are beyond the scope of this course).

Tables of thermodynamic data are usually tabulated at some known reference temperature and pressure, most commonly at a Temperature of 298 K, and Pressure of 1 bar ( = 0.1 MPa ~ 1 atm).  Thus, we if we need to know H at some temperature, T, other than 298 K, we can use the above equation to determine H at the new temperature:


For a reaction, the above equation can be rewritten as:

         (11)

The temperature dependence of entropy, S, is given by:

or

Again, if Cp is not a function of T, then integration results in:

Or, since data are usually available at 298 K and 0.1MPa, for a reaction, this can be written as:

           (12)   

Equation 10 can then be combined with equations 11 and 12 to give the dependence of DG on temperature:

We can simplify this even further if we assume that for a reaction, DCp = 0:

          (13)

Thus, using the assumptions above, we can now calculate DG at our reference pressure, P1 at any temperature, if we know DH and DS at our reference temperature of 298 K.

Pressure Dependence of G and DG

From equation 6, above:

or, for a reaction:


Integrating this, results in:

If we assume that DV is not a function of pressure (in general this is a good assumption for solids, but not for liquids or gases, as we have seen above), then integration results in:

         (14)

Notice that the second term on the left in equation 14 is the same equation (13), above.  Thus, we can substitute equation 13 into equation 14, and rearrange to get our final expression for DG as a function of Pressure and Temperature:

              (15)

Again, however, we must remember the assumptions involved in using this equation.  The assumptions are that DCP = 0 and DV is not a function of pressure.

Calculation of Reaction Boundaries

If we have thermodynamic data for minerals involved in a chemical reaction, then we can use equation 15 to calculate reaction boundaries on a Pressure - Temperature diagram.  Let's consider the following chemical reaction:

NaAlSi3O8 <=> NaAlSi2O6 + SiO2
   albite                           jadeite            quartz


Phase

DH298, 0.1Mpa 
(joules/mole)
S298, 0.1Mpa
(joules/Kmole)
V298, 0.1Mpa
(cm3/mole)
albite -3921618.201 224.12 100.83
jadeite -3025118.24 133.574 60.034
quartz -908626.77 44.207 23.7

(Data from Berman, 1988)

For the reaction, at equilibrium, we can write:

DH298, 0.1Mpa = DHjadeite + DHquartz - DHalbite = -3025118.24 + (-908626.77) - (-3921618.201)

DS298, 0.1Mpa = Sjadeite + Squartz - Salbite = 133.574 + 44.207 - 224.12

DV298, 0.1Mpa = Vjadeite + Vquartz - Valbite = 60.034 + 23.7 - 100.83

Then, since at equilibrium, DG = 0, we can write:

To be consistent we should have DV in units of m3/mole, in which case P will have units of Pa (Pascals).  But since our initial atmospheric pressure is 0.1 MPa, if we leave DV in units of cm3/mole, the results will come out with pressure units of MPa  (note that 103 MPa = 1GPa).

Plugging in the values of DH, DS, and DV, as shown above, we can then plug in a value of T (in Kelvin) and solve for P (in MPa).

The results should look something like the graph shown here, where Pressure has been converted to GPa and temperature is shown in oC.

The dashed line in the graph shows the same boundary calculated using a more vigorous approach, that is taking into account the variation of DH with temperature and DV with pressure.

Note that the reaction boundary is still a straight line, as we would expect from our analysis of solid-solid reactions and the Clapeyron equation, as discussed above.


Reaction Rates (Kinetics)

Thermodynamics can tell us what mineral phases are in equilibrium at a specific temperature and pressure, but does not tell us anything about the rates at which chemical equilibrium is achieved.   During the mineral formation process temperatures are generally increasing, and rates of chemical reactions tend to increase with increasing temperature.  Thus, during the formation process there is usually ample time for equilibrium to occur.  But, as these minerals are brought back to the pressure temperature conditions present at the Earth's surface, temperature will be decreasing.  The rates of the reactions will thus be much slower, and phases stable at high pressure and temperature will often be preserved when we find the minerals exposed at the surface.  Thus, it is common to find metastable phases, i.e. phases that are not stable at the surface, but represent equilibrium at some higher temperature and pressure.  We touched on this previously in our discussion of polymorphism.


Return to EENS 211 Page