|
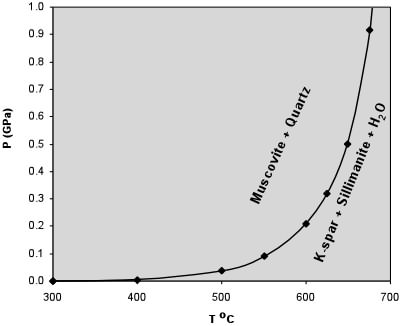
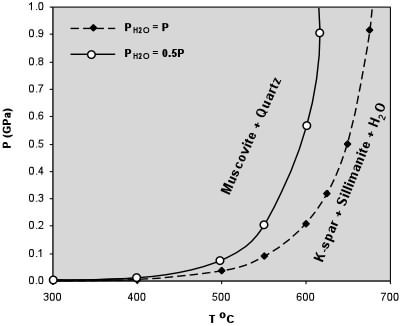
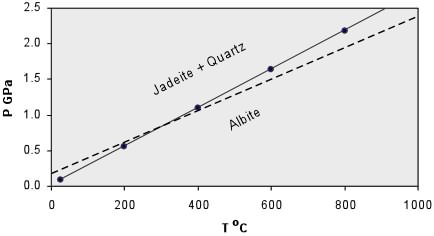
Calculation of Reaction Boundaries
Another relationship that is useful is:
G = H - TS
where G is the Gibbs Free Energy, H is the enthalpy, T is the absolute
temperature in Kelvin, and S is the entropy.
For a chemical reaction, we can rewrite this as:
ΔG = ΔH
- TΔS
(10)
where again:
ΔG = the change in Free Energy of the reaction =
ΣGproducts - ΣGreactants
ΔH = the change in Enthalpy of the reaction =
ΣHproducts - ΣHreactants
ΔS = the change in Entropy of the reaction =
ΣSproducts - ΣSreactants
In general ΔG, ΔH,
ΔS, and ΔV are
dependent of Pressure and Temperature, but at any given T & P:
If ΔG < 0 (negative) the chemical
reaction will be spontaneous and run to the right,
If ΔG = 0 the reactants are in equilibrium
with products,
and if ΔG > 0 (positive) the reaction
will run from right to left.
Temperature Dependence of G, H, and S
As stated above, G, H, and S depend on Temperature and Pressure.
But, because G depends on H and S, it is usually more convenient to
consider the temperature dependence of H and S, so that if we know H and S
at any given temperature, we can calculate G.

where
Cp is the heat capacity at constant pressure. The heat
capacity is the amount of heat necessary to raise the temperature of the
substance by 1o K.
Thus:
or
If
Cp is not a function of temperature, then further integration
results in:
(Note
that in general, Cp is a function of temperature, and the known
function of temperature could be inserted before integration, but this
introduces complications that are beyond the scope of this course).
Tables of thermodynamic data are usually tabulated at some known reference
temperature and pressure, most commonly at a Temperature of 298 K, and
Pressure of 1 bar ( = 0.1 MPa ~ 1 atm). Thus, we if we need to
know H at some temperature, T, other than 298 K, we can use the above
equation to determine H at the new temperature:
For
a reaction, the above equation can be rewritten as:
 (11)
(11)
The
temperature dependence of entropy, S, is given by:

or
Again,
if Cp is not a function of T, then integration results in:
Or,
since data are usually available at 298 K and 0.1MPa, for a reaction, this
can be written as:
 (12)
(12)
Equation 10 can then be combined with equations 11 and 12
to give the dependence of ΔG on temperature:
We
can simplify this even further if we assume that for a reaction, ΔCp
= 0:
 (13)
(13)
Thus, using the assumptions above, we can now calculate ΔG
at our reference pressure, P1 at any temperature, if we know ΔH
and ΔS
at our reference temperature of 298 K. |
(6)
(7)
 (16)
(16)
 (17)
(17)